Learn in this case study
- For large food manufacturers, customer fulfillment performance is more than a KPI - it is a promise to retailers and end consumers alike.
- One of our clients with a complex, multi-tier supply chain already operated at a high level of performance. Their OTIF (On-Time-In-Full) rate consistently ranged between 93–95%. Yet their ambition was clear: to reach 97–98%, a level where operational excellence becomes a true competitive advantage.

The Challenge: When “Good” Data Still Isn’t Enough
Like many mature organizations, the client already tracked delivery failures and manually assigned reason codes to missed or incomplete customer orders. In theory, this should have provided transparency into the root causes of OTIF issues.
In practice, it did not.
- Manual reason code attribution was time-consuming and often treated as an afterthought.
- Root causes were sometimes misclassified or overly generic.
- Most importantly, the process lacked an E2E perspective across the supply chain, i.e., the raw data was available but disconnected.
As a result, the organization knew that orders were missed but not necessarily why.
To move beyond symptom tracking, two key questions had to be answered:
- What was the objective true root cause of a missed delivery?
- If a disruption occurs today, what will be its impact on OTIF weeks into the future?
Before we got to the fun part however, we had to dig deep into the data.
E2E Data Model
While the client already had high-quality analytics within individual supply-chain functions, the challenge was to connect these data silos in a coherent way. We represented the supply chain as a knowledge graph consisting of entities, events and the links in between:
- Entities are time insensitive nodes, obtained from master data.
- Events are time sensitive actions aggregated to a suitable granularity whose KPI’s are obtained from plans / transactional data.
- The definition of edges (temporal dependencies between nodes) was a highly non-trivial task as it required a deep understanding of the customers SC including lead-times, delays and rippling effects.
On top of this, we ingested and transformed heterogeneous data sources including BW reports, Excel sheets, and ad-hoc extract and mapped them into a coherent ontology.
This ontology allowed us to consistently align structured and semi-structured data, and critically, to map unstructured data to concrete entities/events within the knowledge graph.
Automatic Root Cause Discovery Using the “5 Whys”
To answer the first question, we translated a classic lean concept into an algorithmic approach: the Toyota “5 Whys” method.
Instead of manually assigning reasons, we built a root cause tree that mirrors the logical structure of the supply chain from customer delivery back through production, inventory, and suppliers.
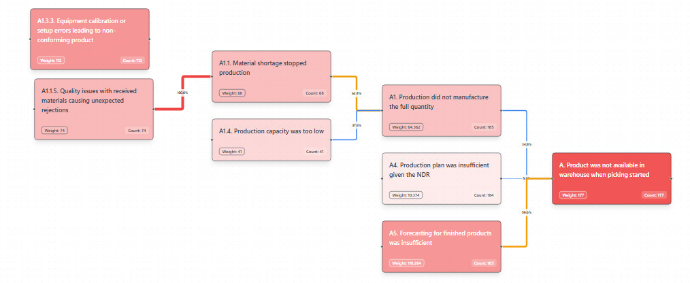
Figure 1: Excerpt from the root cause tree
How it works
The algorithm starts at the top of the tree:
“The customer order was not delivered in full.”
From there, it systematically traverses downstream causes by comparing planned vs. actual states at each node:
- According to the plan, sufficient finished goods should have been available
- Actual inventory levels were lower than expected
- Why? A production order was not completed as planned
- Why? Raw material was missing
- Why? A supplier delivery arrived late several weeks earlier
Each internal node performs a data-driven consistency check (e.g. expected vs. observed inventory, output, or supply), fully respecting lead times and process dependencies.
The result:
- Automated, objective root cause identification
- No manual reason codes required
- Full transparency from customer impact back to supplier performance
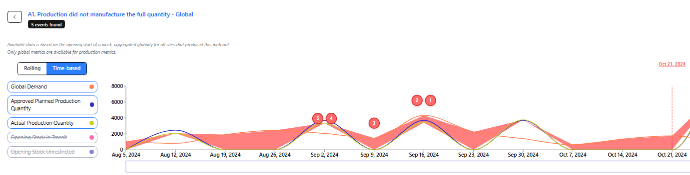
Figure 2: Automatic identification of root causes
From Explanation to Prediction: Quantifying Future OTIF Risk
While understanding past failures grants insights into systemic issues, the arguably more powerful capability is answering questions such as:
“What is the probability of an OTIF failure in three weeks if supplier X fails to deliver today?”
Why traditional approaches fall short
A naive forward calculation might assume:
Less supply → less raw material → fewer finished goods → lower OTIF
While directionally correct, this approach breaks down because:
- Production outcomes are not deterministic (scrap, quality losses, lot sizing)
- Supply chains are not static — planners actively mitigate disruptions
Learning the Real Impact from Historical Data
To overcome these limitations, we combined deterministic logic with data-driven learning:
- A baseline forward (pessimistic) model assumes that issues simply propagate through the SC.
- A learned function captures how disruptions actually propagated in the past
This allows us to estimate how a disruption observed today statistically affects future OTIF including the likelihood and magnitude of impact.
Evaluating Mitigation Actions Before They Are Taken
The same model can also simulate countermeasures:
- What happens if we expedite an additional delivery?
- How much OTIF risk is reduced by increasing order quantity?
- Which mitigation action is the most cost-effective one?
By recalculating the learned function for alternative scenarios, planners can quantify the effect of mitigation actions before executing them — turning OTIF management from reactive firefighting into proactive decision-making.
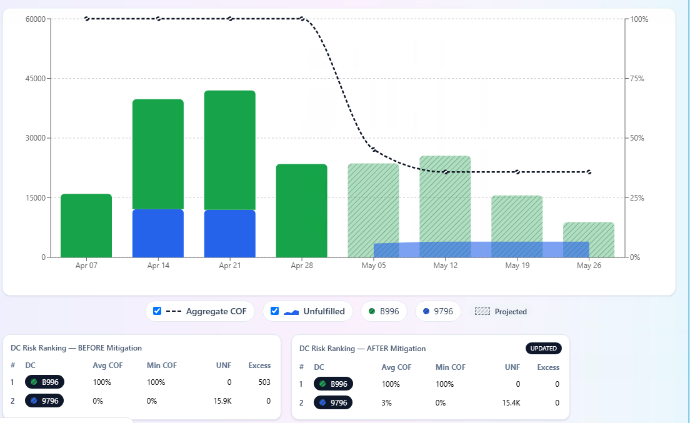
Figure 3: Projected COF% and calculated effect of mitigation action (redistribution of goods)
The Result: Turning the Last Percent into a Strategic Advantage
By combining automatic root cause discovery with predictive impact modeling, the client achieved:
- End-to-end transparency across the supply chain
- Objective, data-driven explanations for missed deliveries
- Early warning signals for future OTIF risk
- Quantified decision support for mitigation actions
Get in touch with our team for deeper insights and explore what’s possible for your business.
#SupplyChainOptimization #OTIF #OperationalExcellence #DataDrivenSupplyChain #PredictiveAnalytics #RootCauseAnalysis #KnowledgeGraph #SupplyChainAI #Manufacturing #ContinuousImprovement #5Whys #SupplyChainVisibility